

Ruben Alcott
Chief pilot

Imaging, mapped application and the reading that ties the two together — flown by the people who write the maps.
Pulled from flight logs and settled harvest data across six seasons of contracts. If a figure cannot be traced to a grower's books, it is not on this page.
Cover a field wall to wall and your worst corner and your cleanest strip get exactly the same treatment. On most ground that means a third of the tank lands on plants that were fine to begin with.
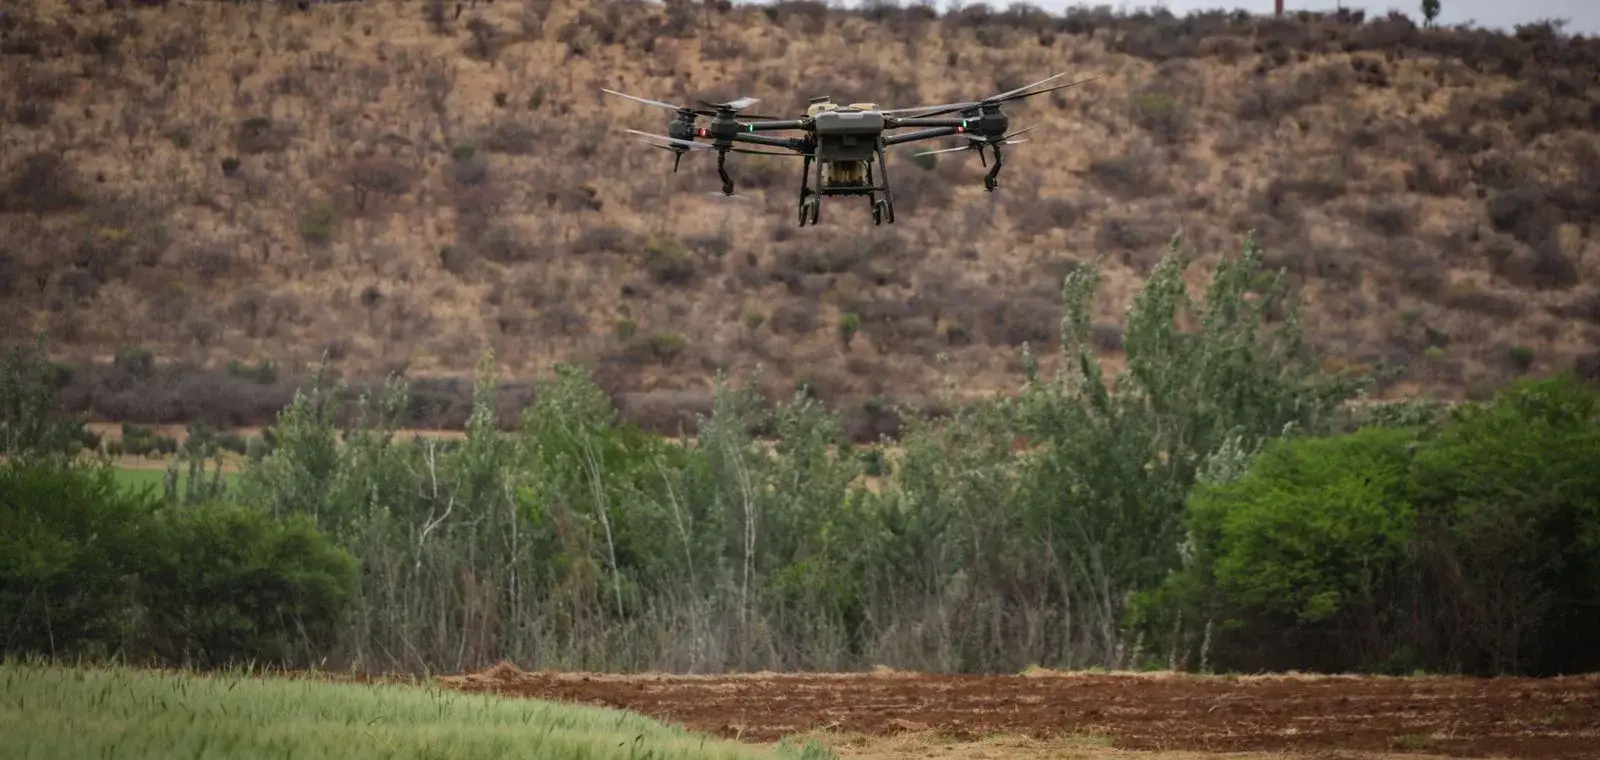
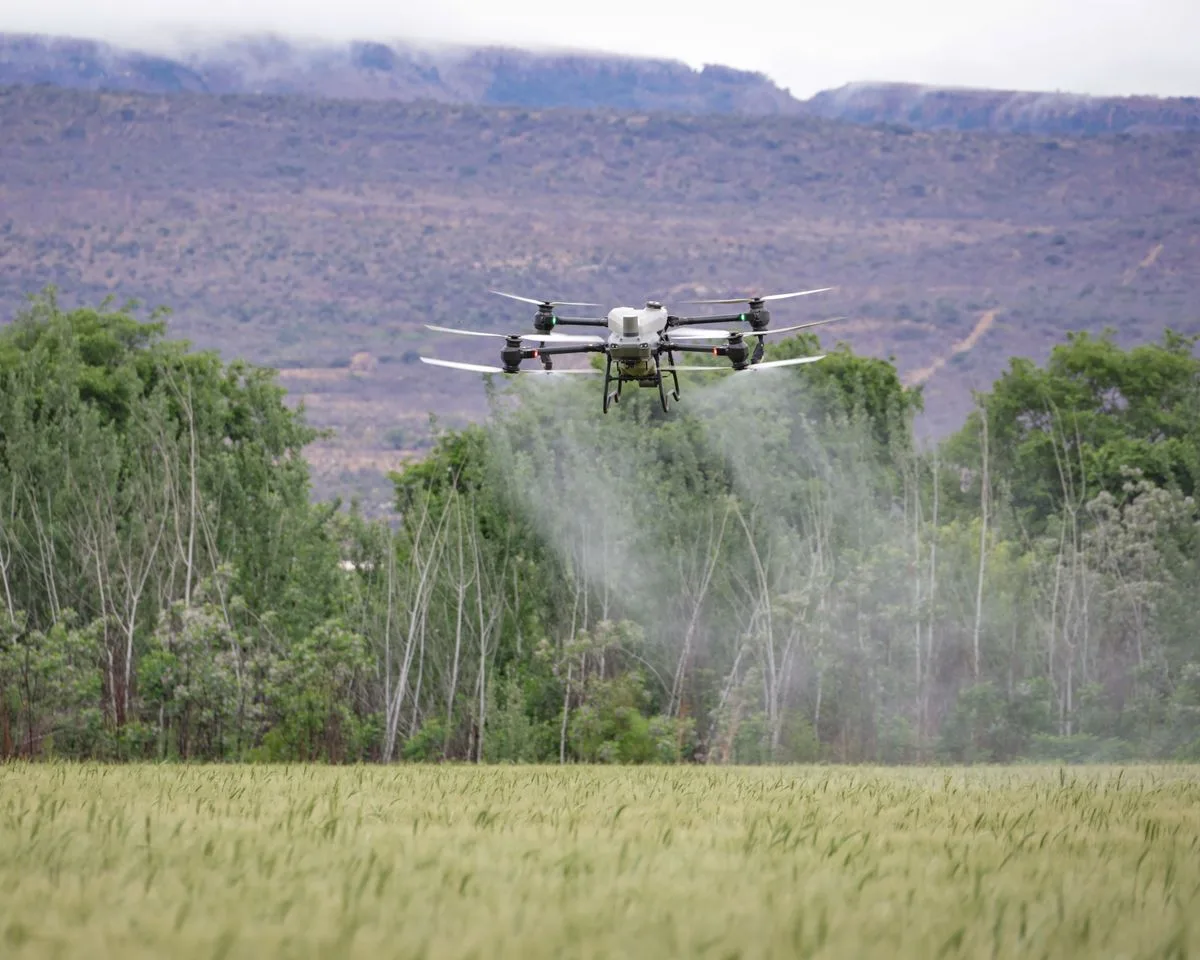
Flow climbs inside a flagged zone and drops to nothing over headlands, drains and buffer strips, without anyone touching a control.
No tracks, no pinch rows, no compaction. In a wet spring that is often the only way a field gets treated on time at all.
Rotor wash pushes droplets down into the canopy, and each pass records wind speed, heading and nozzle state as it goes.
Acre-by-acre proof of product, place and time — ready for your agronomist, your grain buyer or an organic certifier.
Nothing gets applied to a field we have not imaged first. Skip that step and you are back to paying for chemistry on acres that were already healthy.
Send us boundaries and this year's plan. We clear airspace, log obstructions, note the neighbours who need warning, and file the operating notice.
One full imaging pass builds the layer every later flight is compared against. Without it, week six is guesswork dressed up as data.
An agronomist converts the imagery into a rate file, sends it over with the reasoning written out, and nothing is loaded until you reply.
The aircraft flies the map, and a follow-up pass a week later shows whether the crop actually responded. Then the cycle repeats.
Every mission arrives in Fieldline as a short list of what moved since the last flight, ranked worst first — not four gigabytes of imagery for you to squint at after supper.
Each flagged zone carries an estimated bushel loss attached, so the order of work chooses itself.
Shapefile, GeoTIFF and ISOXML as standard, with direct handoff into John Deere, Trimble and Raven controllers.
Let a landlord see one quarter, or an adjuster see one storm, without opening the books on the whole operation.
2.1 HA · SOUTH-EAST · TREAT IN 48 H
6.4 HA · STRIPS 7–9 · WATCH
34,100 PLANTS/AC · +2% ON PLAN
THERMAL DELTA 0.4 °C · NORMAL
Every rate map is signed off by someone who has walked the crop, and every aircraft is flown by someone who holds the rating on it.



We ask for a review once the season is closed out and the numbers are settled. Nothing below has been edited.
What sold me was the follow-up flight. They come back a week later and show you whether the pass did anything. I had never had a service offer to be graded on its own work before.
Our blocks sit on a grade nobody wants to take a sprayer onto. The crew finished the whole thing in an afternoon, and the top of the canopy came out better covered than we ever managed by hand.

The chemical we did not buy covered the contract before August. The surprise was the water map, which explained a patch we had been treating as disease for four straight years.

They flew the quarter I had written off two years ago. The report came back the same evening with a tile line marked on it, and that field is back in rotation.

The as-applied log settled a boundary argument with a neighbour inside ten minutes. That alone was worth the season.

We used to spray on the calendar. Now we spray on the map, and the invoice for chemistry came in a third lower without a single acre going backwards.

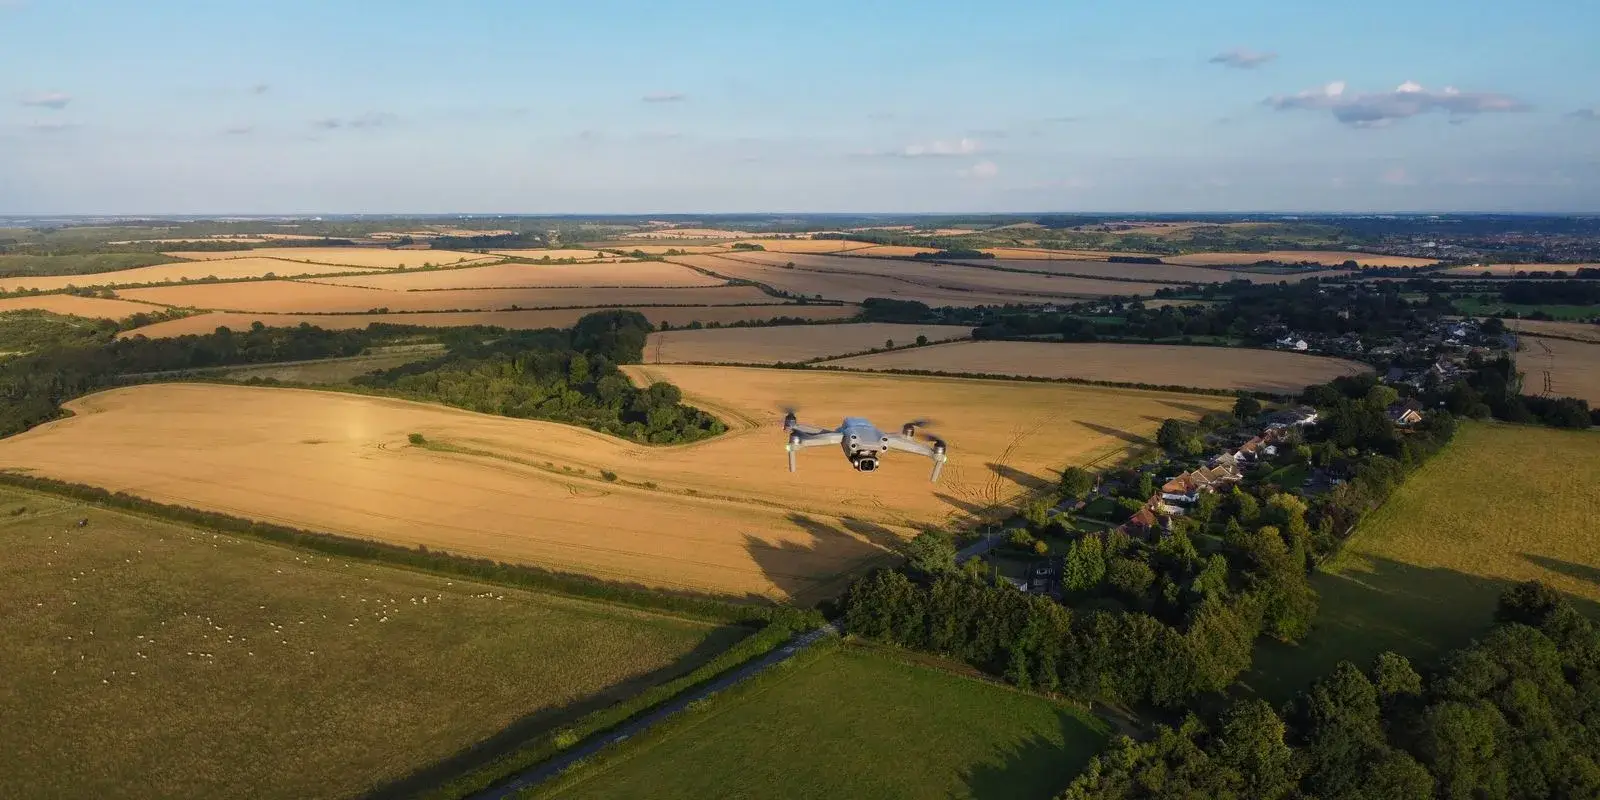
We will fly it once at our cost, hand over the report in full, and leave the decision with you. Demo slots go out within ten working days right through the season.